Twitter Case Study – Month 2
I have a Facebook group where I share insights and answer content, marketing, social media questions and that sort of thing.
We recently took on a new type of client, and for some of their social media accounts we're starting from scratch, so we thought it would be interesting to do a case study to share with you. I shared the first part of the case study with my group. This one here is the second part.
This account was started in May.
This is June's update for the Twitter account we're building. (unfortunately, I can only share analytics and screenshots, the client wants to keep their name confidential for now).
Twitter… ok. So WHAT?
Twitter can still drive traffic. All the stats are great and fun to look at, and it's a fun challenge to make those stats grow day after day, but at the end of the day, this next question is what we care about.
Did it bring visitors to our sales page, or lead page, or conversion page? Yes or No?
At the end of the day, for June, Twitter drove about 24% of the traffic to the website, still a far cry from Instagram at 74.5%.
So the answer is a solid YES.
Ok so let's get on with it.
Basics:
- Started: May 2022
- Followers: 730
- Following: 153
- Lists: 1
- Total Tweets: 520
- Likes: 5038
- niche: Influencer / entertainer
We're in discovery mode, establishing a routine, schedule and fine-tuning the content. You'll notice spikes and valleys in the analytics, once we hone down into the type of content and frequency, these graphs should be more consistent.
June Summary
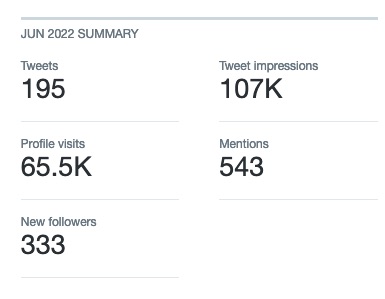
New followers come from:
- Tiktok
- Email newsletters
- Twitter ecosystem
- Website
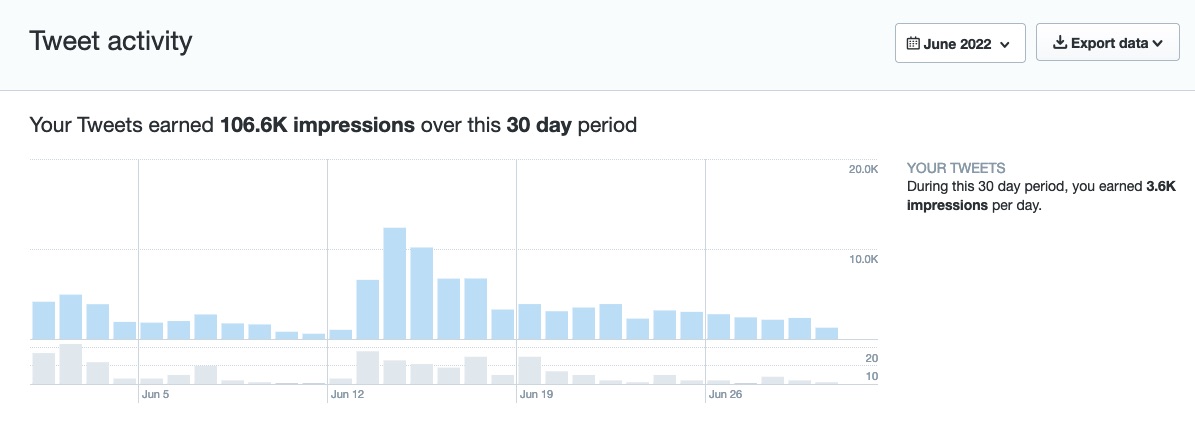
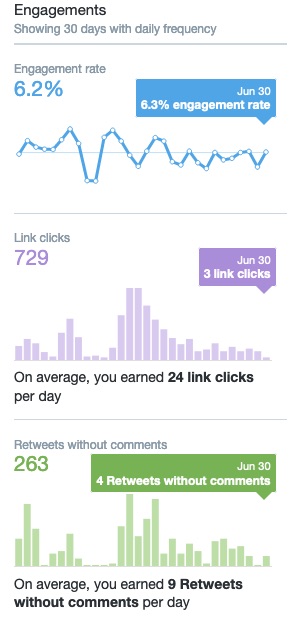
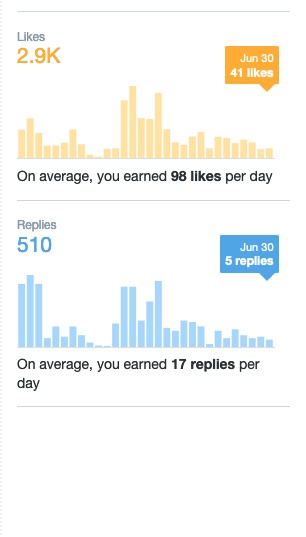
Impressions earned on Twitter:
- 3.6K impressions per day
- 6.2% engagement rate
- 729 clicks (24/day)
- 263 retweets without comments (9/day)
- 510 replies (17/day)
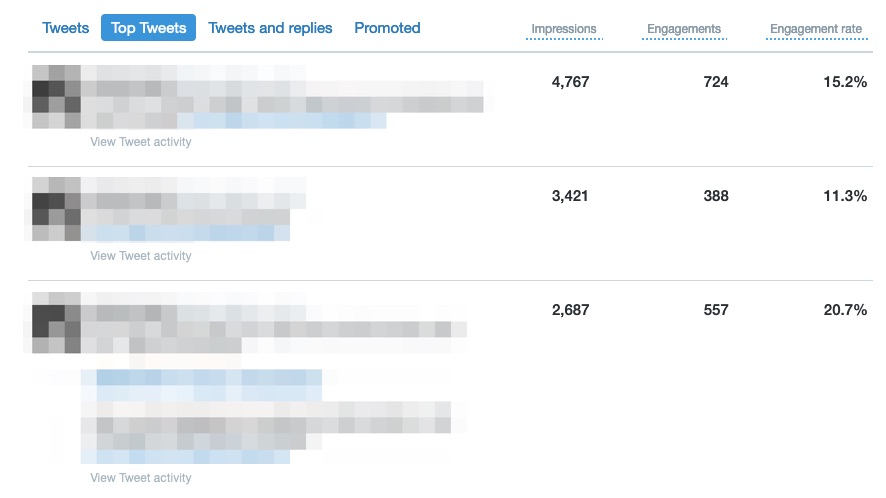
Top three tweets:
We tweet every day, most of the time once or twice, but on some days we'll spend 20 min or so tweeting and might do 10 tweets in a day's period.
- Top tweet #1. – Time and context personal point of view and an invitation to take action, + a picture. –
4767 impressions, 724 engagements, 15.2% engagement - Top tweet #2 – Direct call to action + a picture.
3421 impressions, 388 engagements, 11.3% engagement - Top tweet #3 – Outstanding promotion – date limit FOMO, 3 hashtags and a picture to match the context.
2687 impressions, 557 engagements, 20.7%
Bottom three tweets:
I don't think of them as “bad” tweets, they're just the last three when I sort by “top tweets” if you look at the numbers, they're still great numbers, I guess Twitter values impressions over everything else, because I'm loving the 40% engagement on that very last tweet!
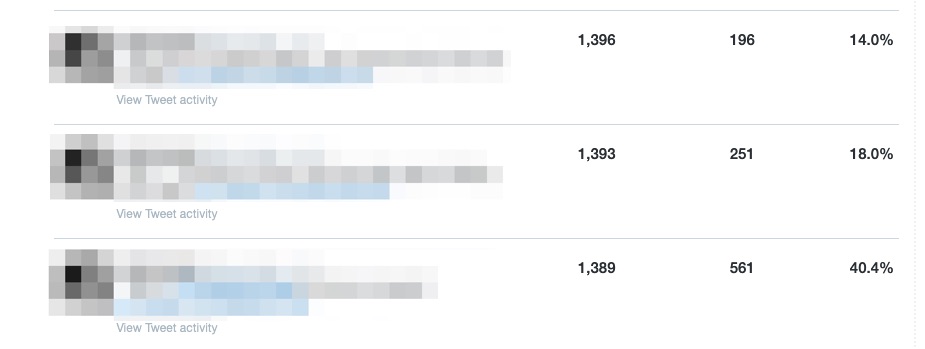
Average tweets get between 75 – 700 impressions and engagement between 6% and 40%.
The most engaging tweets have pictures or video, but it's natural for this niche which is highly visual.
Video Activity
- 13.7K views
- 28 videos
- 5.1k minutes watched
- 171 minutes watched per day
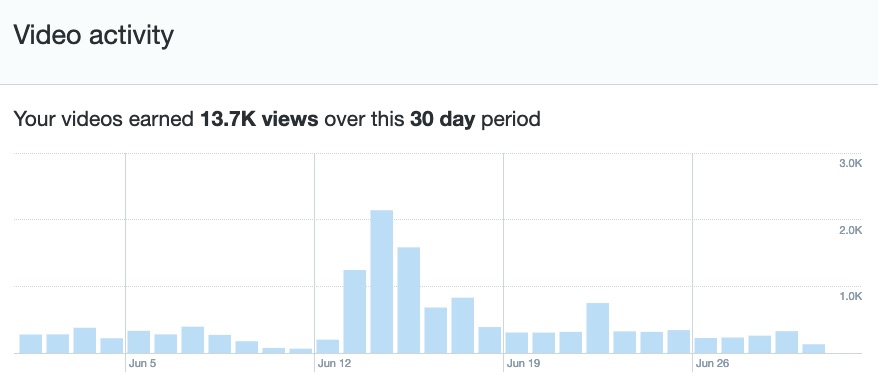
The videos are a combination of clips from other videos on IG or TikTok or a compilation of other clips. The most engaging videos are 7-20 seconds long.

If you found this useful, have comments questions or feedback, let me know on Twitter or join my content and influence marketing group on Facebook.